Graph Visualization
By passing the --graphs-dir parameter and providing a directory where you want the graphs to be placed, Lancet will write deBruijn graphs for each window inspected and place them into directories within the designated graphs directory. NOTE: whichever directory is given as the graphs-dir will be cleared so be mindful of what directory you provide.
lancet2 pipeline -t tumor.bam -n normal.bam -r ref.fasta --graphs-dir ./graphs
The above command will create dbg_graph and poa_graph directories in the provided ./graphs directory. In the dbg_graph directory, you will find the dot files generated by the tool for each window. In the poa_graph directory, you will find the gfa graphs generated for each window along with an accompanying fasta file
deBruijn DOT graphs
The dot files can be rendered using the dot utility available in the Graphviz visualization software package.
dot -Tpdf -o example_file.pdf example_file.dot
The above command will create a example_file.pdf file that shows the graph. For large graphs, Adobe Acrobat Reader may have troubles rendering the graph in which case we recommend opening the PDF file using the "Preview" image viewer software available in MacOS.
Below are examples of different levels of debruijn graphs that can be produced from Lancet2 outputs:
(a) Raw: 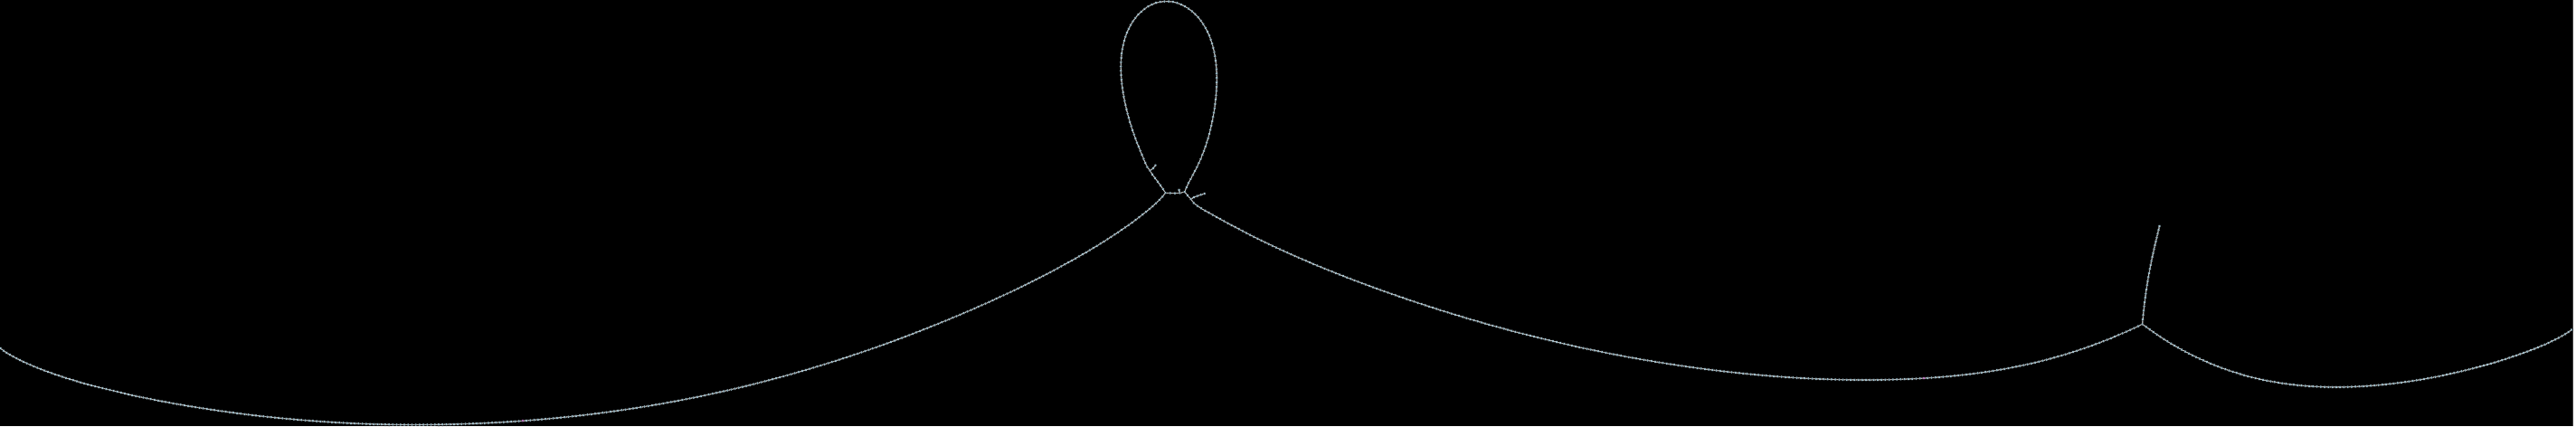 (b) Compressed:
 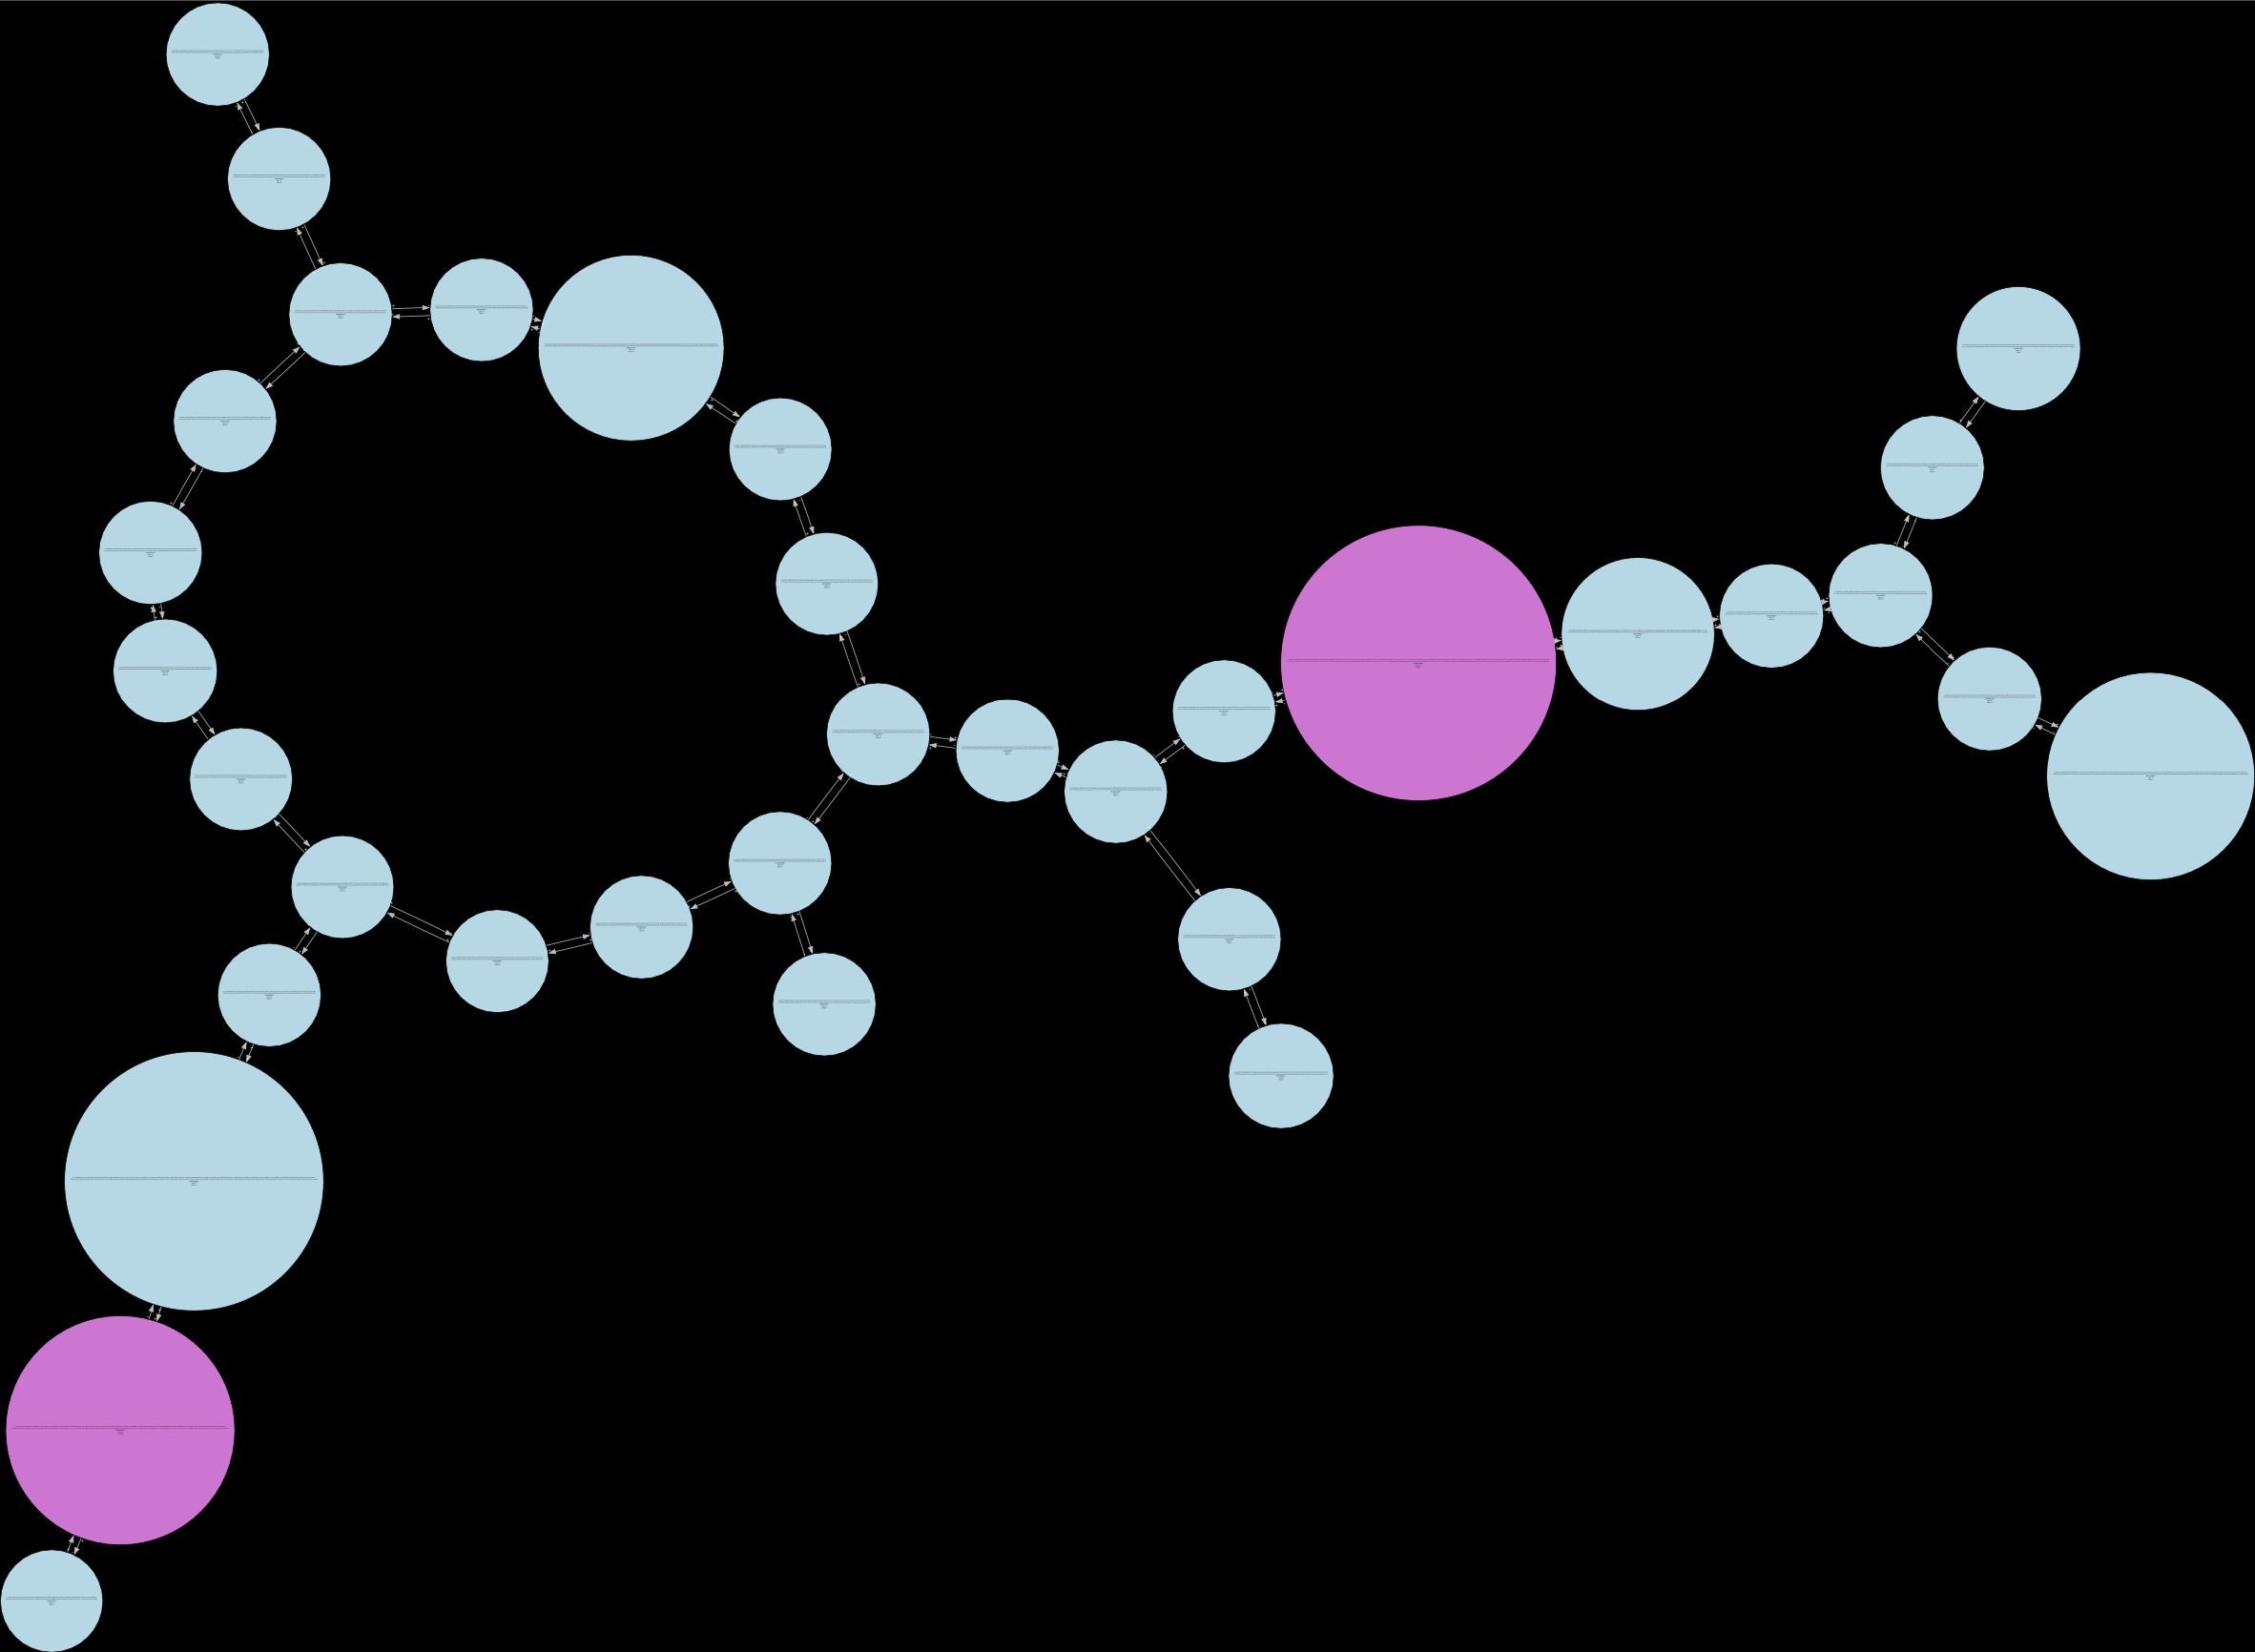 (c) Fully pruned:
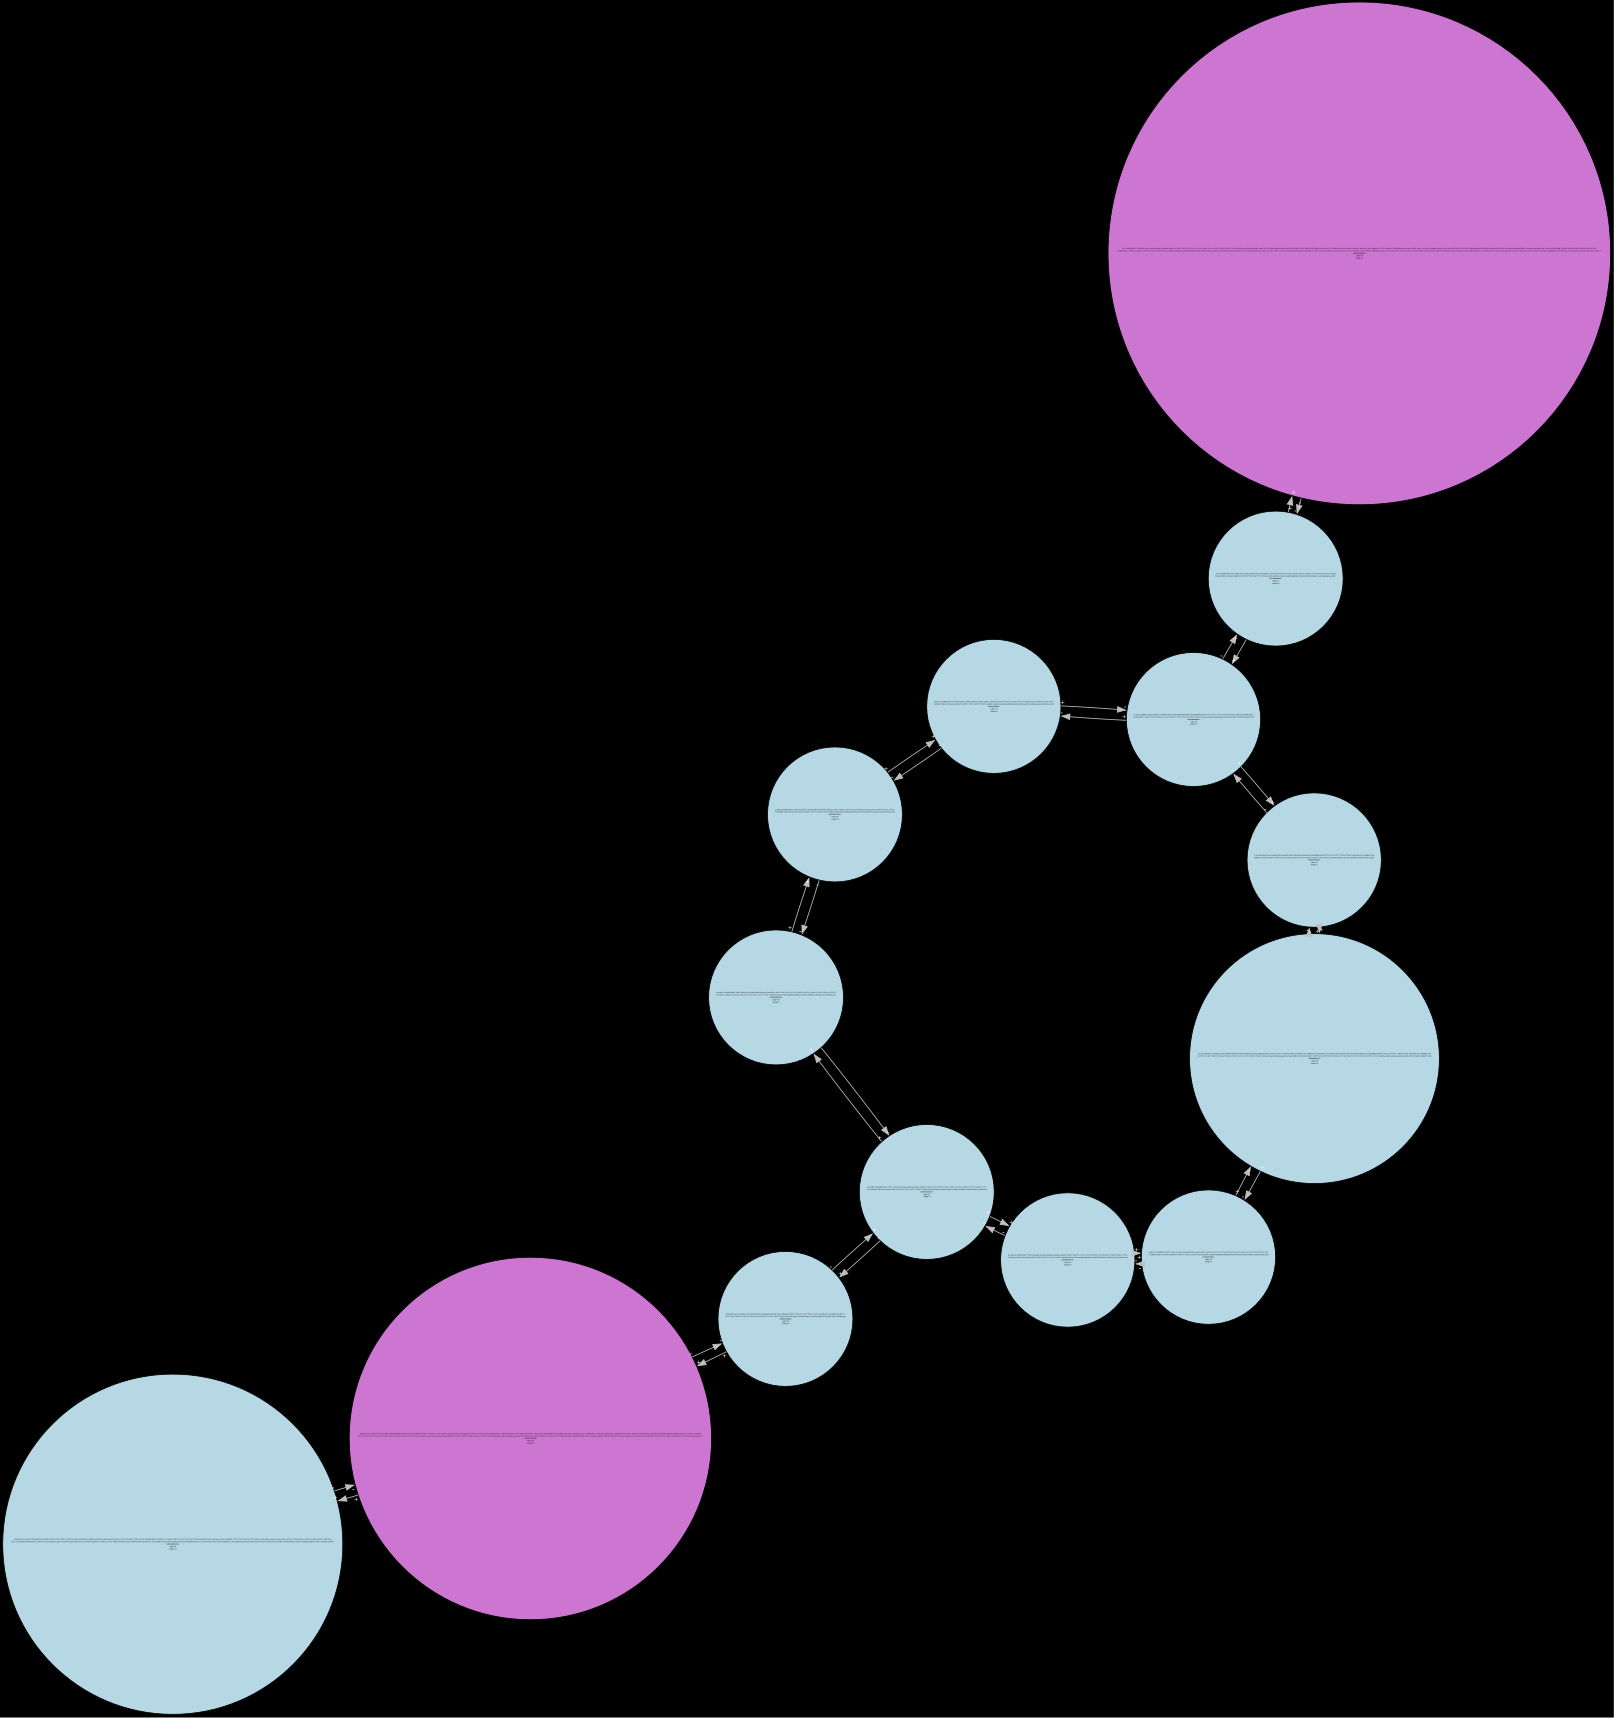
GFA graphs
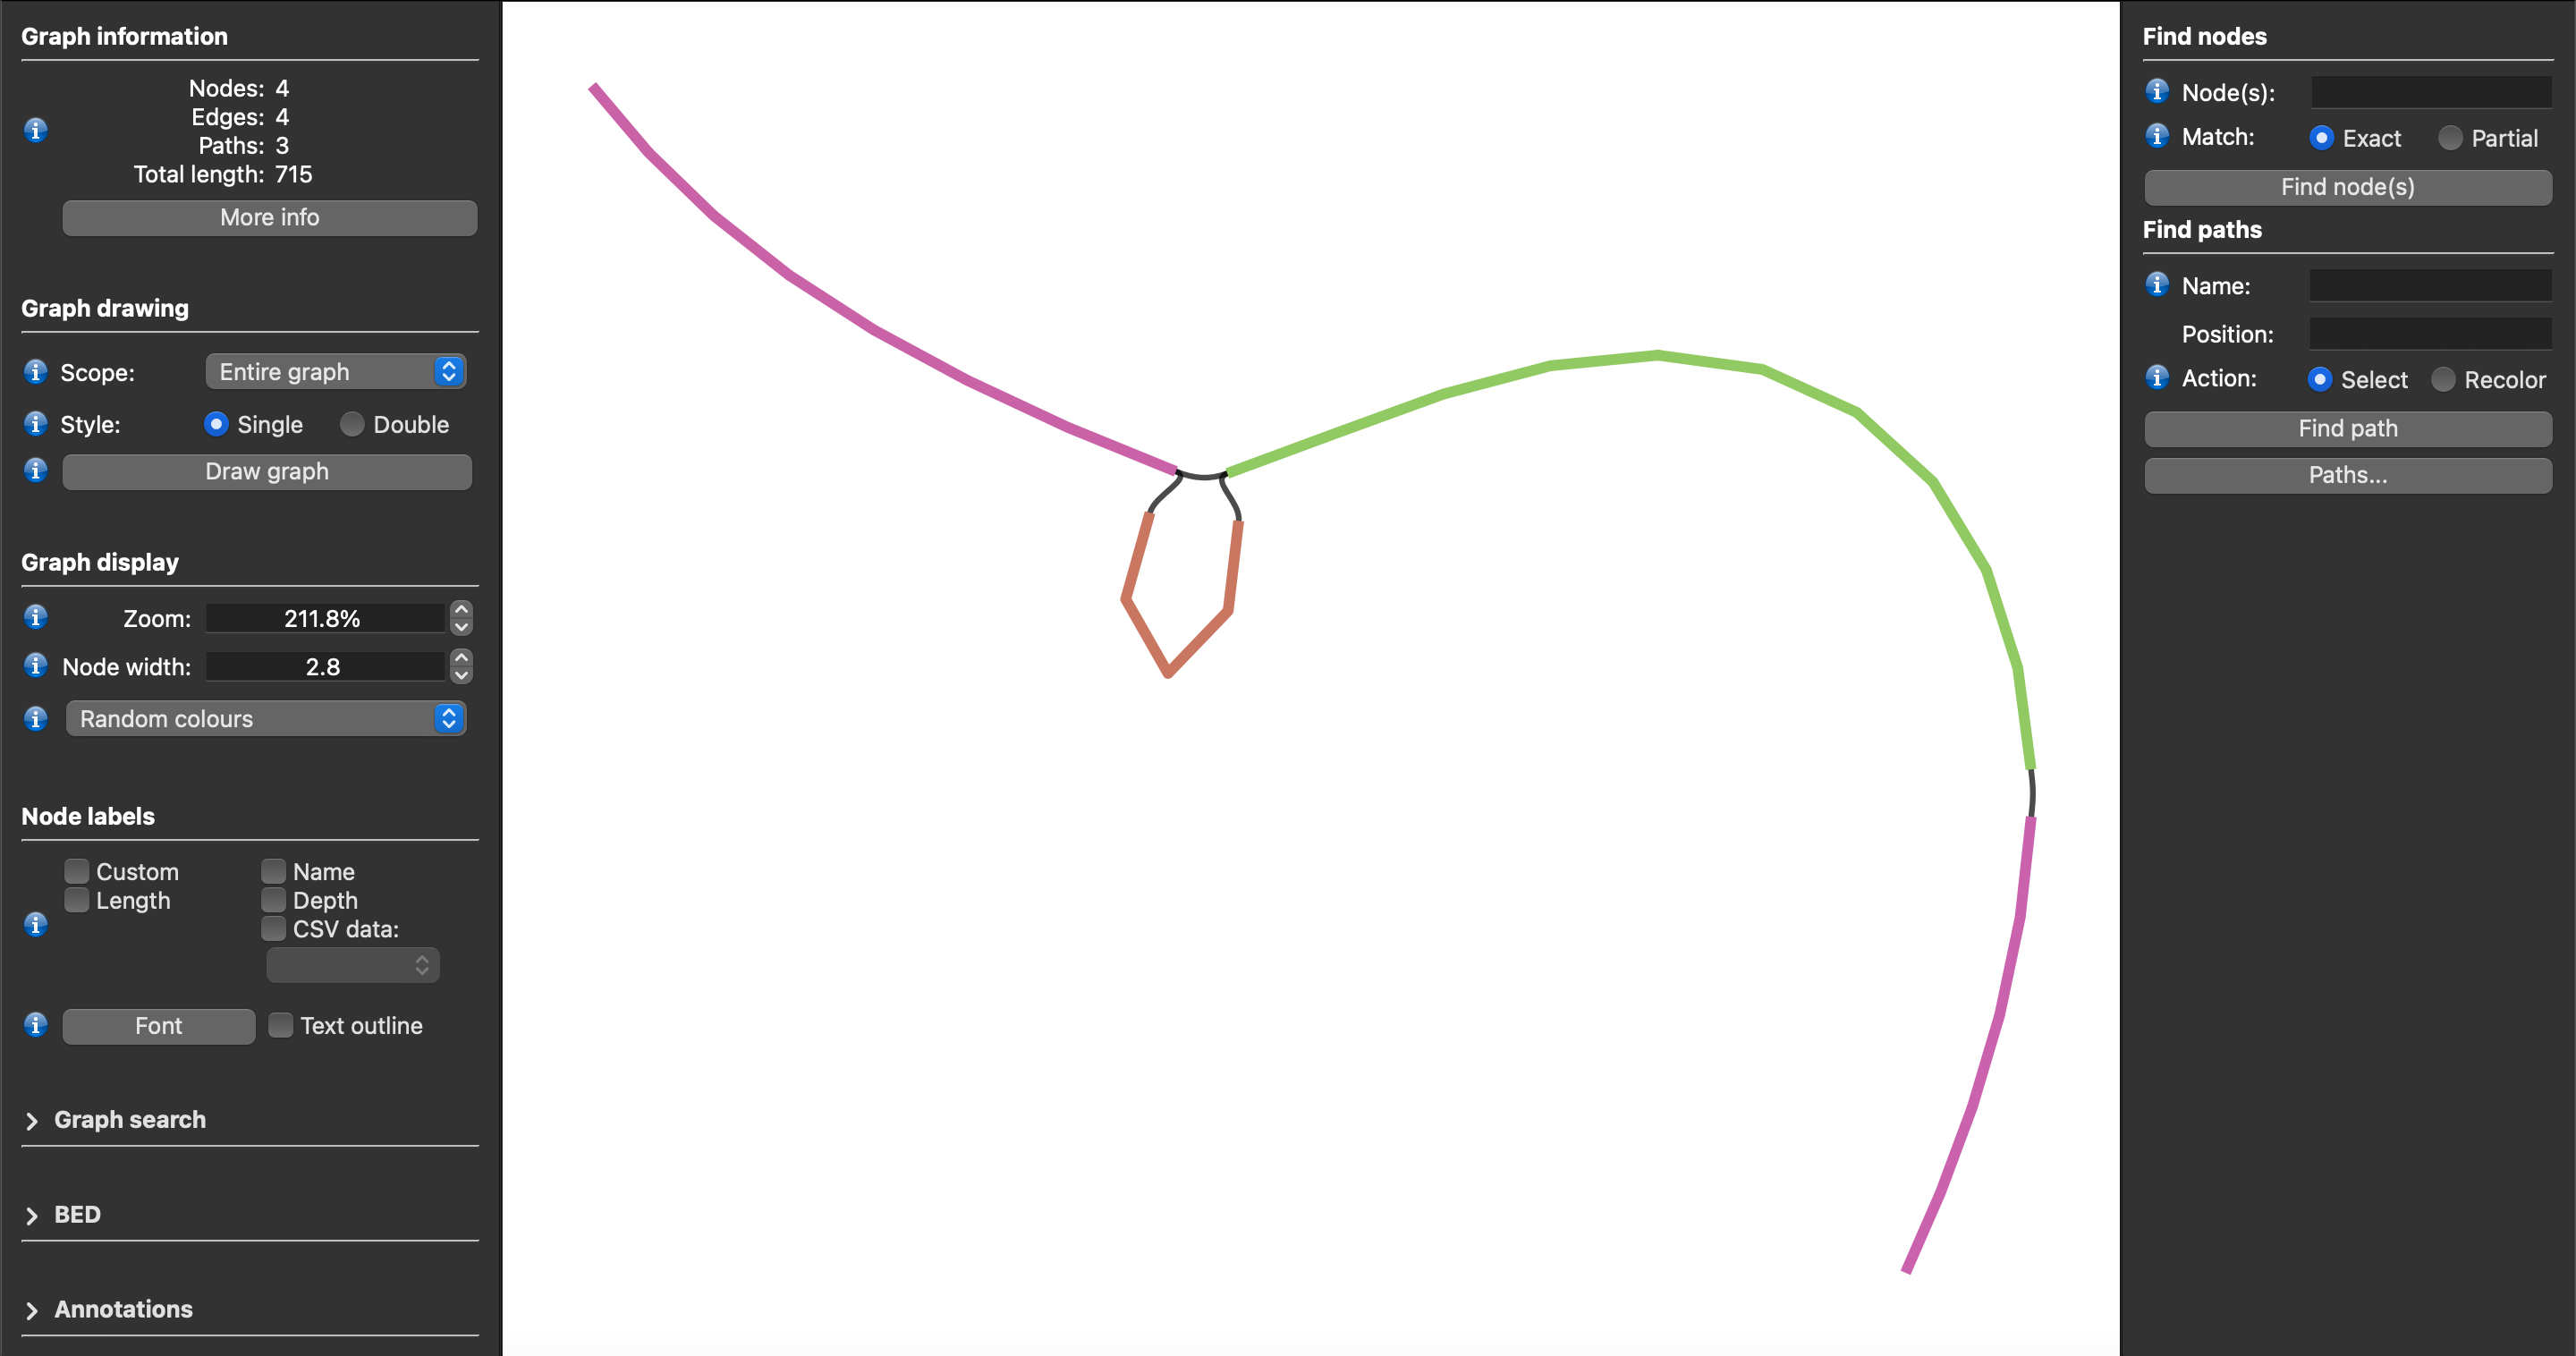
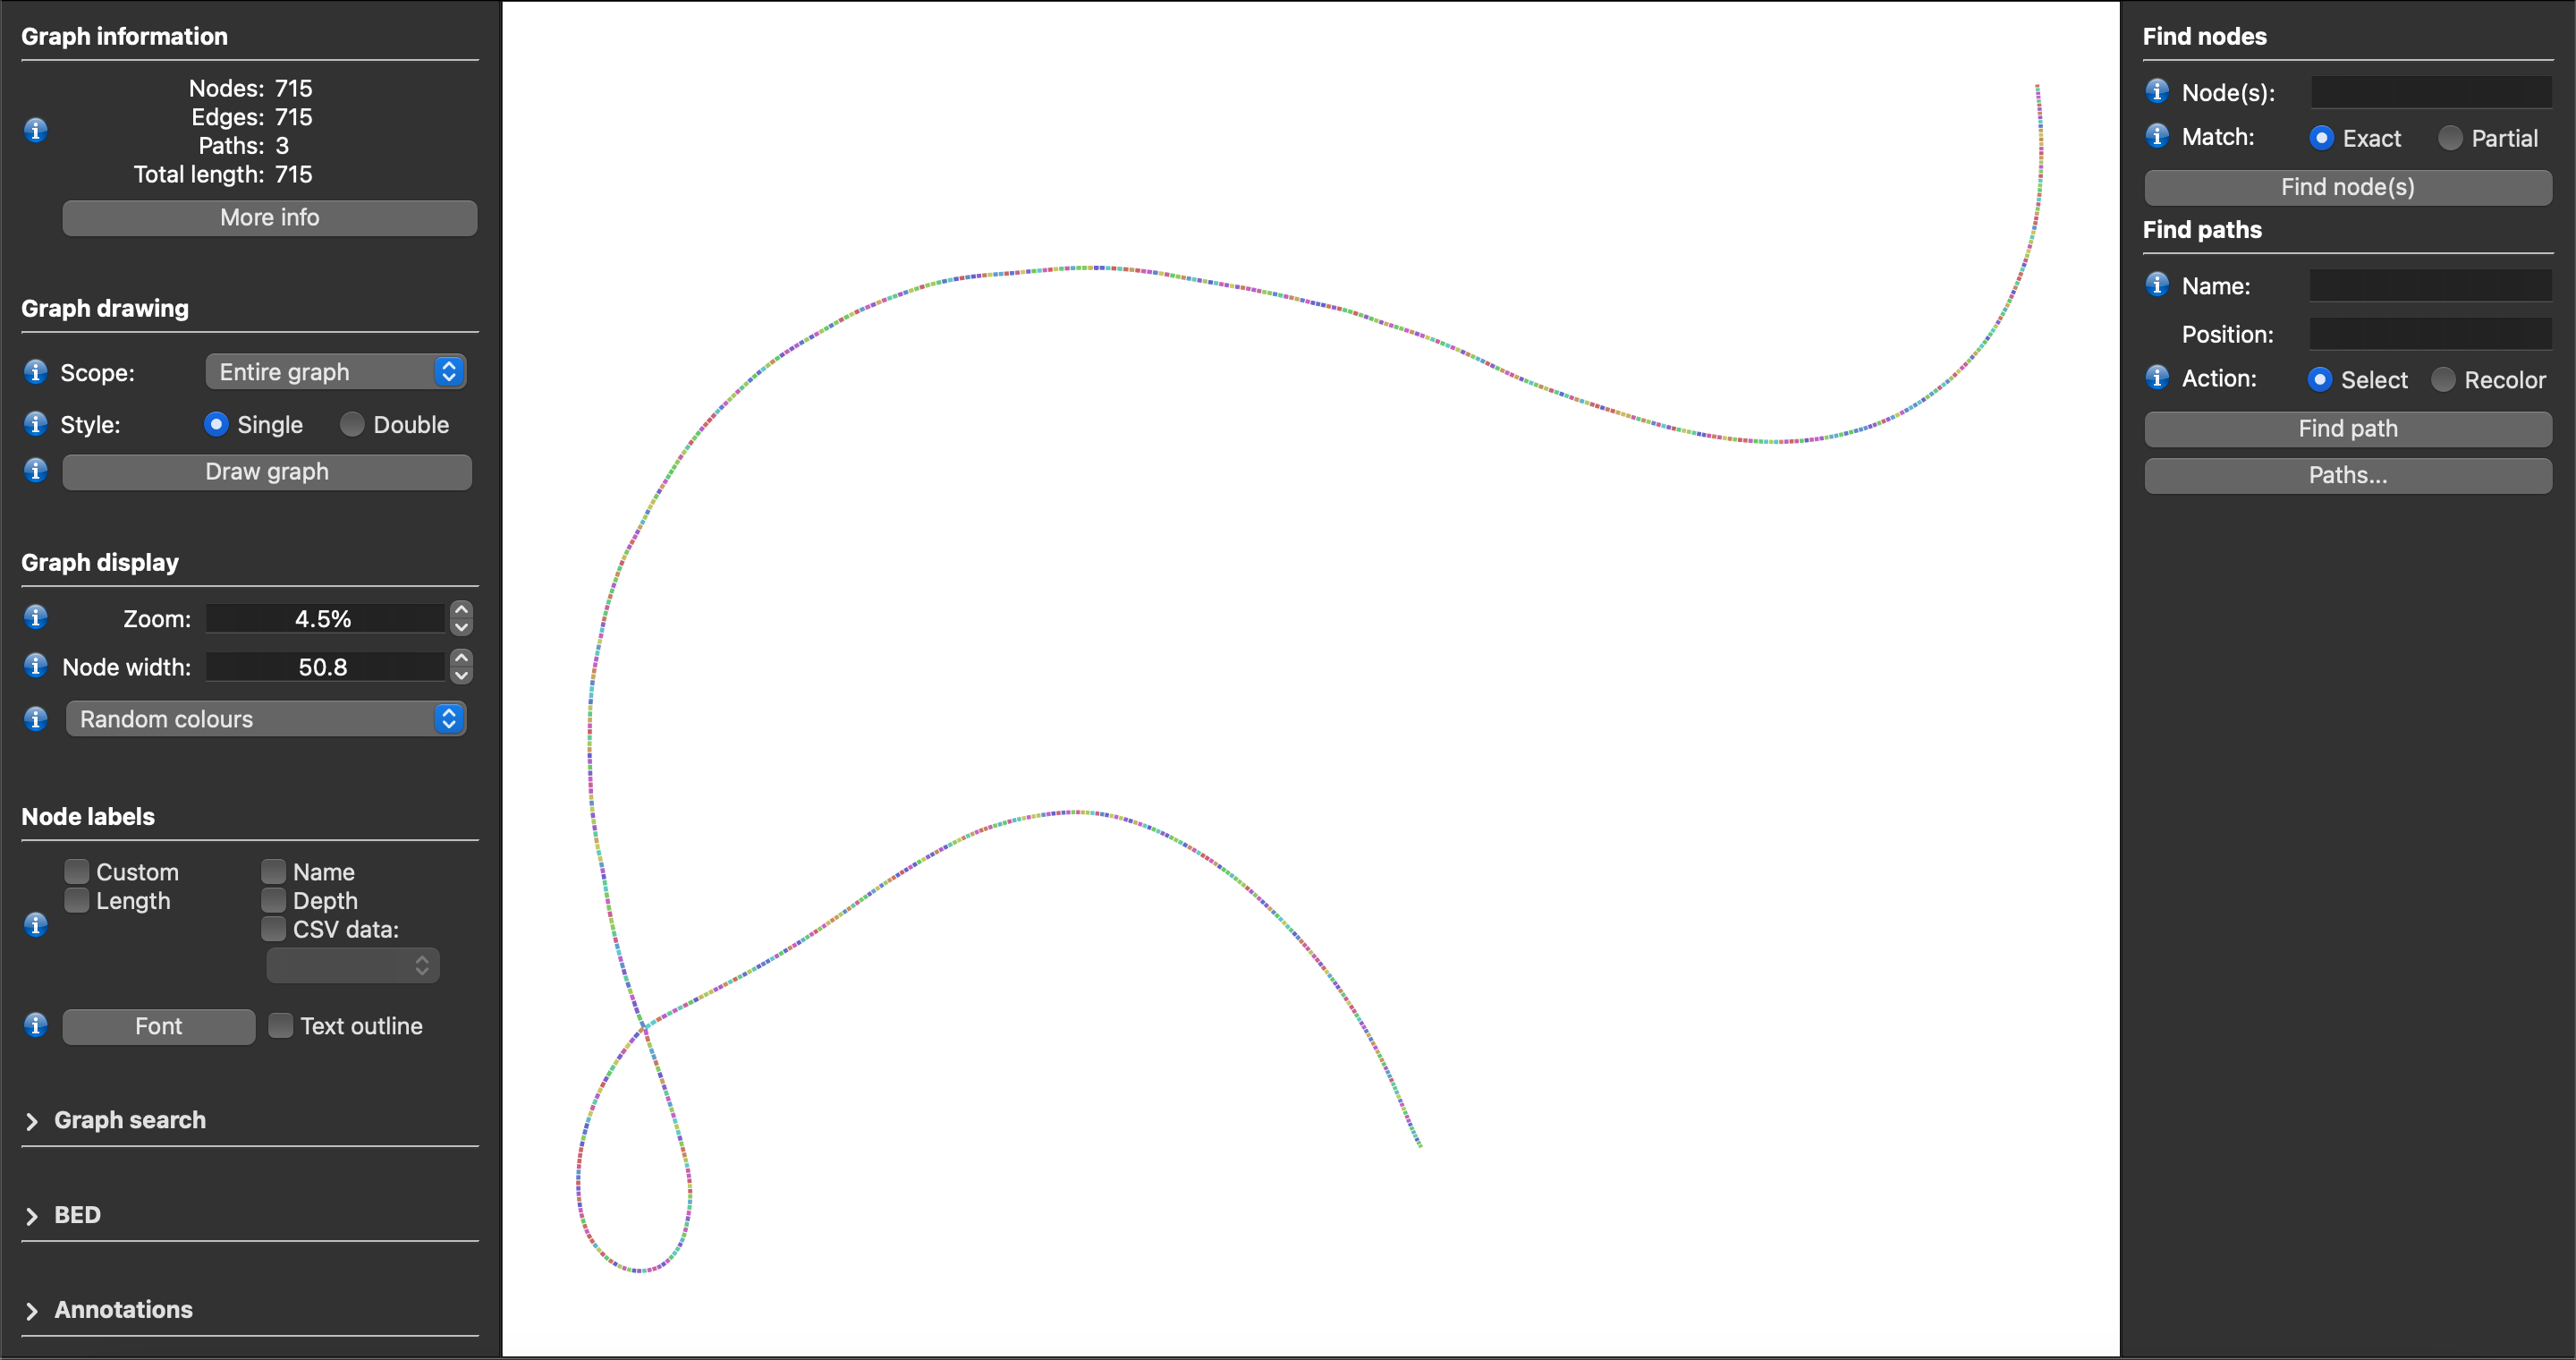
The generated gfa files can be viewed using the Bandage-NG program.
By loading these gfa files directly into Bandage-NG and viewing the graphs, you get something that looks like this:
By adding an additional step of using the unchop command in the vg repository, the GFAs can be simplified such that nodes are combined by removing edges where doing so has no effect on the graph. Here is the general command for unchopping the gfa along with the resulting graph of the same window:
vg mod --unchop $INPUT_GFA > $OUTPUT_GFA